Customer-driven Clean Energy Leadership in 2023 Points Toward Momentum Growing in 2024
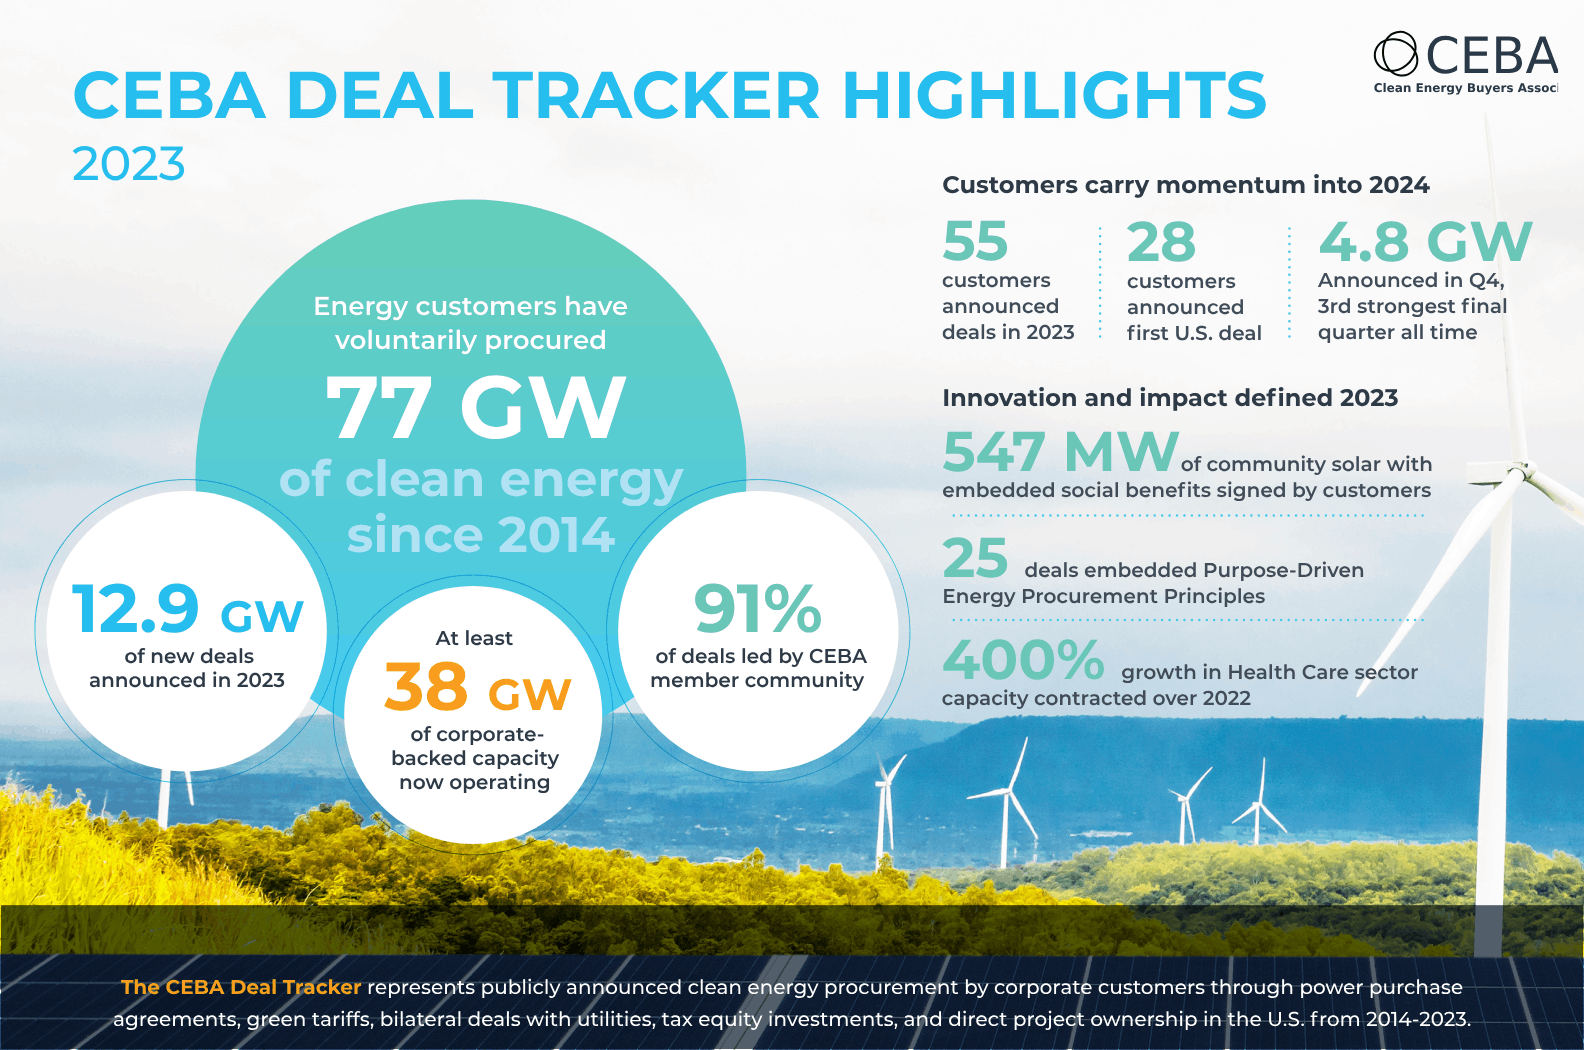
The clean energy transition charged ahead in 2023 as leadership from corporate energy customers continued to accelerate the pace of change. Fifty-five energy customers announced transactions totaling nearly 13 GW of new utility-scale, off-site clean energy in the U.S. last year. This is more than the total wind and solar capacity installed in all but two states — Texas and California1. The increase happened in spite of a market that has continued struggling to catch up to growing customer demand for new clean power, often due to delays in installing the infrastructure to support it. As the CEBA community looks toward 2024, several indicators show that the market is beginning to catch up and that the momentum behind customer-driven leadership will continue.
The new clean energy capacity that corporate customers announced in 2023 brings the 10-year U.S. total to more than 77 GW, which is more than the total wind and solar capacity of the aforementioned leading states, Texas and California, combined2. These two states contain more than a third of all installed clean energy capacity in the U.S. This all doesn’t just exist in fancy press releases. Steel continues to go into the ground, and more than half of this capacity — at least 38 GW — is now operating and producing clean, carbon-free electricity on the grid.
Many customers may survey their options and note what seems like a disconnect between these figures and what is available to them. Power Purchase Agreement (PPA) prices continued to rise year over year in key U.S. markets, particularly for solar, which accounted for more than 70% of the corporate-driven volume announced in 2023. Permitting and interconnection challenges continue to snarl projects in large markets such as PJM (the Pennsylvania-New Jersey-Maryland Interconnection), although regulatory relief may be on the horizon. Still, the utility-scale solar industry grew 77% over 2022, with a total of 22.5 GW installed, according to the Solar Energy Industries Association3. More options are becoming available to customers, and the best time to act on leadership targets is now.
Challenges faced by others did not intimidate the 28 customers who announced their first U.S. deal in 2023 — more than half of the total companies transacting last year worked through these complexities for the first time. New and established customers alike have responded by taking advantage of a growing number of options outside the traditional PPA. While PPAs comprised more than 80% of 2022’s announced capacity, that number fell by a quarter in 2023, as volume under utility options increased, alongside record procurements and investments using mechanisms like community solar and tax equity. As tax credit transfer provisions under the Inflation Reduction Act become more available to customers in 20244, and the focus on aligning social and environmental co-benefits with clean energy continues growing5, more opportunities for customer leadership in these areas are expected.
These are only some examples of the leadership and innovation being driven by CEBA members, who are behind more than 90% of all customer-driven, utility-scale clean energy deals in the U.S. To learn more, see the full 2023 CEBA Deal Tracker Update, which CEBA members can view on the CEBA InterConnect platform.
Stay tuned for CEBA’s State of the Market report at CEBA Connect: Spring Summit. Registration is now open to join us in Denver, CO, May 22–24. And, throughout the year we will be sharing spotlights on the leadership and innovation being driven by CEBA members in 2024 and beyond.
If you have information about a clean energy project your organization is involved with that you would like to share, please contact the CEBA team at communications@cebuyers.org. All information is kept confidential and is reported in the aggregate only.
1 U.S. Energy Information Administration. (2023, September 28). Historical state data. https://www.eia.gov/electricity/data/state
2 U.S. Energy Information Administration. (2023, September 28). Historical state data. https://www.eia.gov/electricity/data/state
3 Solar Energy Industries Association. (2024, March 6). U.S. solar market insight. https://www.seia.org/us-solar-market-insight
4 The White House. (2023, September 21). Clean energy tax provisions in the Inflation Reduction Act. https://www.whitehouse.gov/cleanenergy/clean-energy-tax-provisions
5 Clean Energy Buyers Institute. Principles for purpose-driven energy procurement. https://cebi.org/programs/beyond-the-megawatt/principles